Companies Analysis Project
A data-driven project analyzing financial trends of various companies over a sixteen years period. Tools used: Excel, R, MySQL, and Power BI.
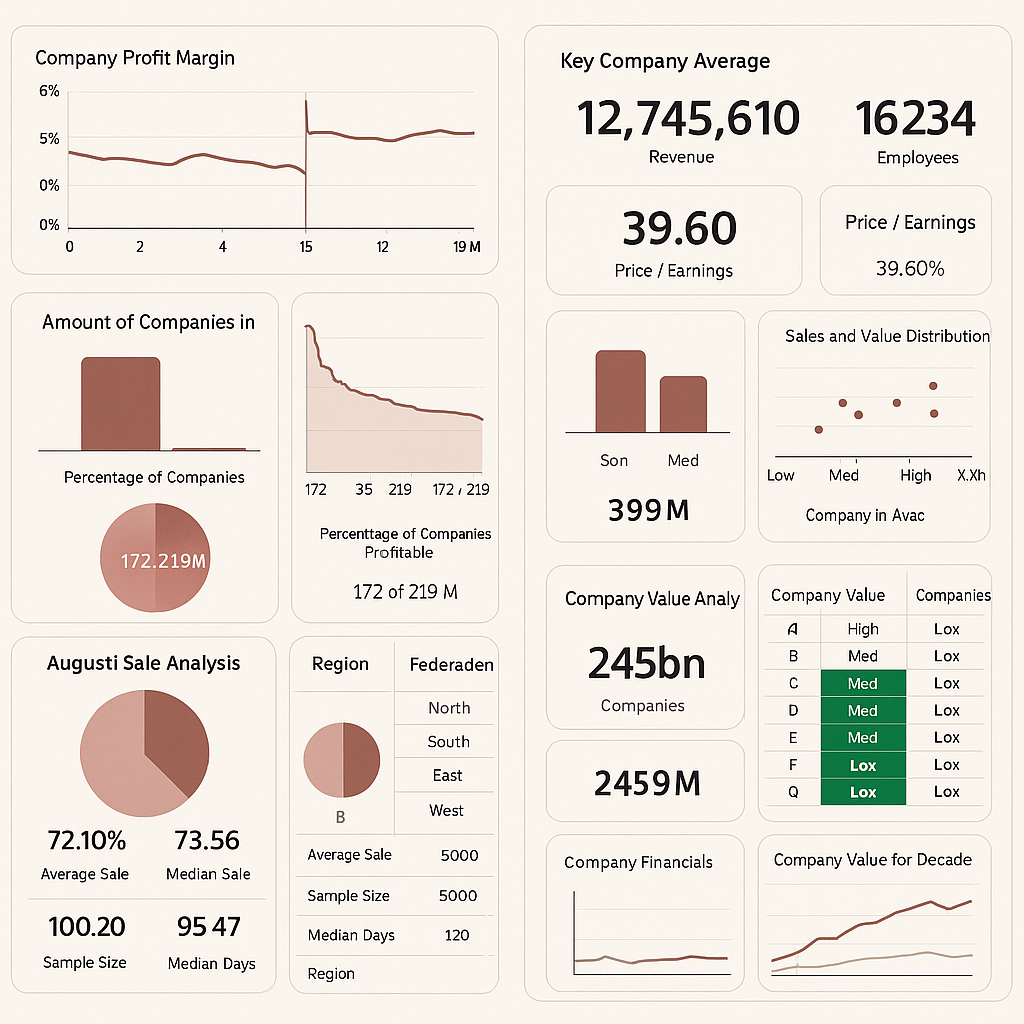
This analysis dives deep into revenue, net income, liabilities, and market ratios to uncover key patterns behind business success or failure. The goal is to identify survival indicators and risk factors using a combination of statistical techniques and interactive dashboards.
Project Highlights
-
Cleaned and organized financial data from 20 companies
Used R for trend analysis, summary statistics, and data visualization
Created SQL scripts for structured financial queries
Built an interactive Power BI dashboard to present findings