Decoding Corporate Mortality
Why do industry giants vanish? This project uncovers the hidden financial triggers that separate survival from total collapse over a 16-year timeline — powered by Excel, R, MySQL, and Power BI.
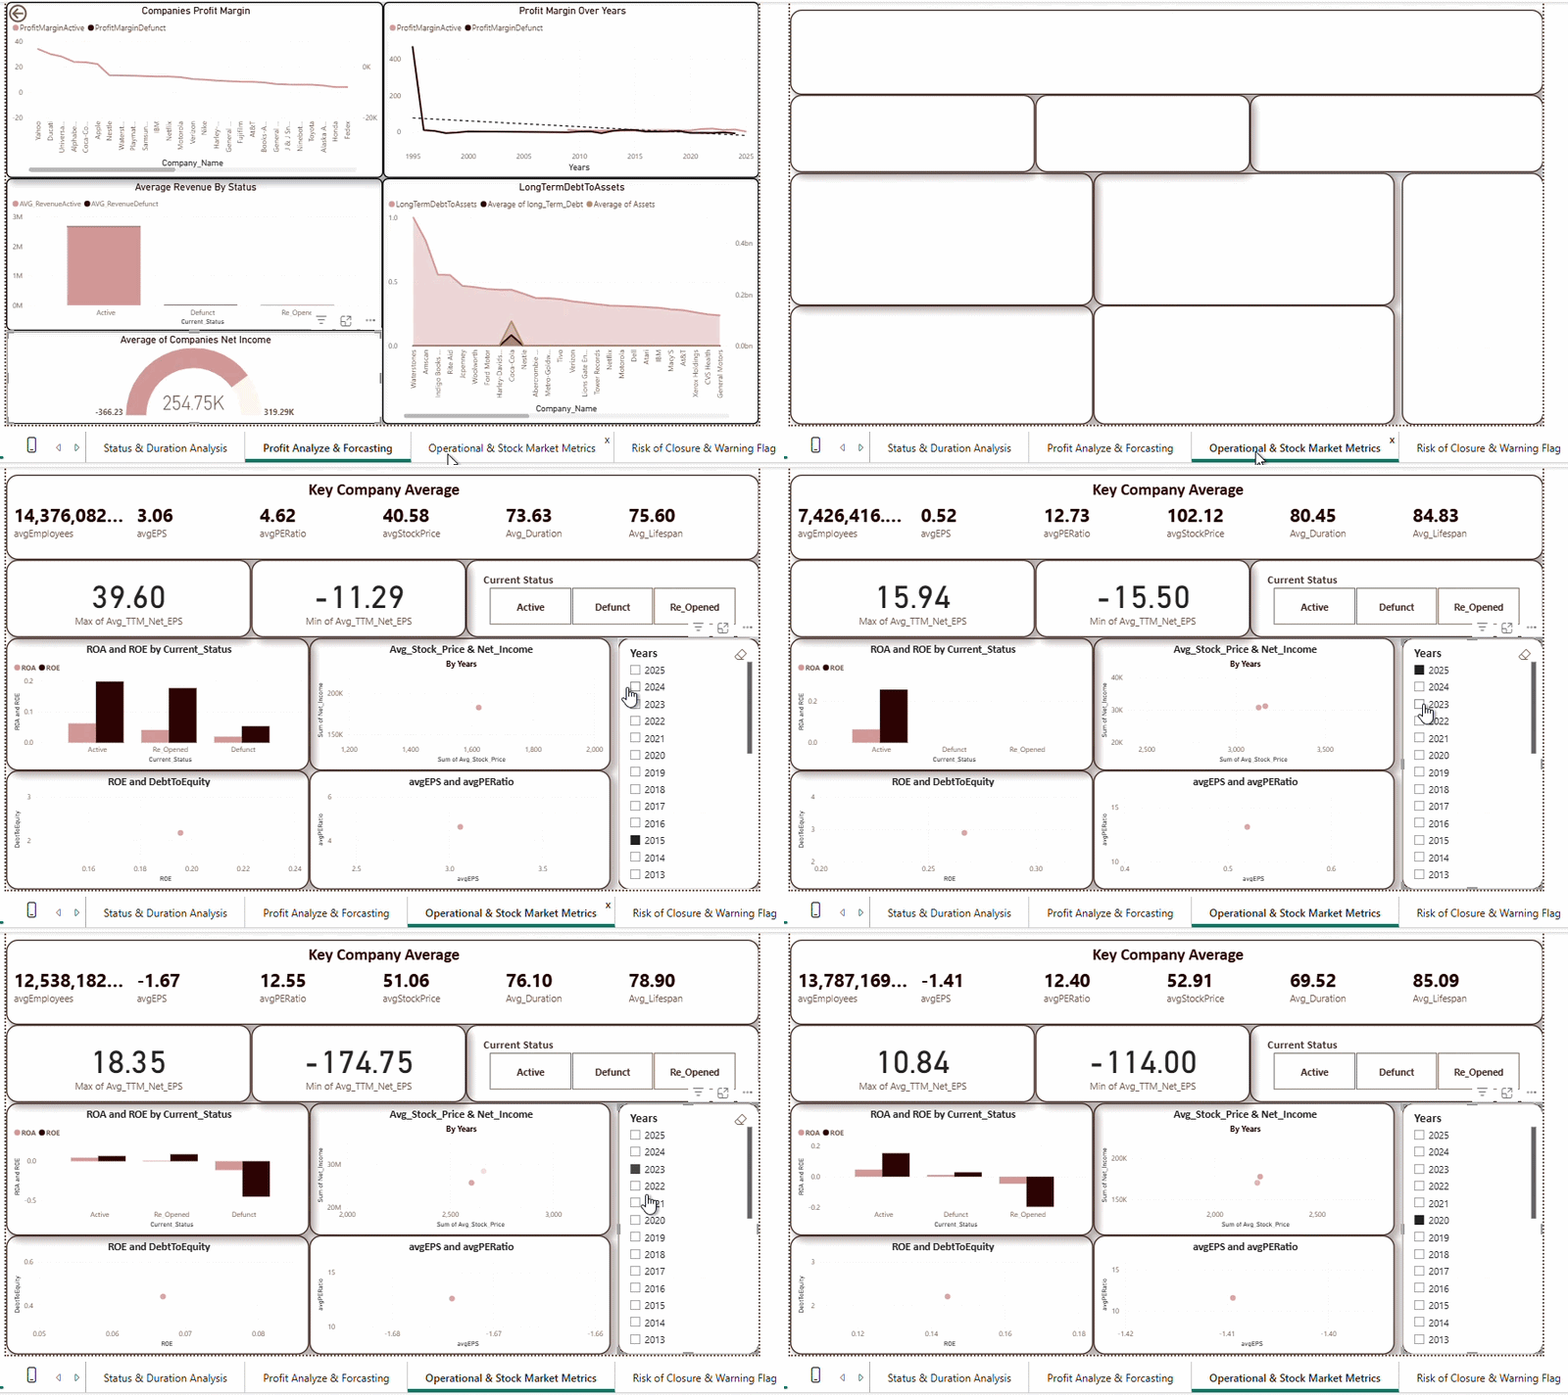
Every corporate collapse leaves a trail of early warning signs hidden deep within balance sheets.
This analysis dives straight into revenue trends, liabilities, net income, and market ratios to isolate the ultimate metrics of business risk.
By merging rigorous statistical analysis with dynamic visual storytelling, the framework serves as a proactive diagnostics tool to assess financial instability and project future market downturns before they manifest.
Project Highlights
-
Cleaned and organized financial data from 200 companies
Used R for trend analysis, summary statistics, and data visualization
Created SQL scripts for structured financial queries
Built an interactive Power BI dashboard to present findings